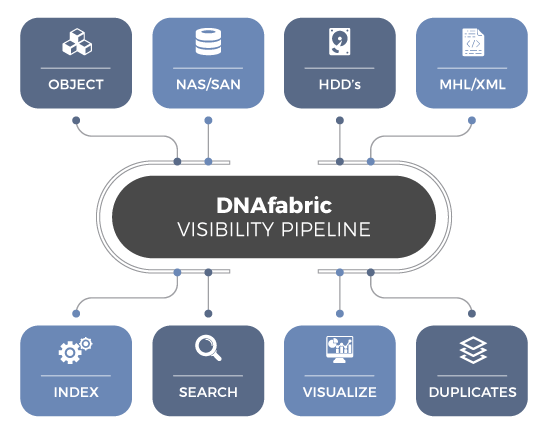
Data is quickly growing and at the same time becoming more distributed. DNAfabric provides a global storage management platform that can index, search, track and visualize metrics across data pools – may that be central, remote, field or cloud.
Big Data Visualization
MEETS DATA MANAGEMENT
DNAfabric’s Data Visibility services is a data visualization toolset designed for C-level executives and heads of departments enabling real-time tracking of data for improved provisioning, utilization, spending and protection.
Beyond Current Analytics Tools
Current tools attempt at providing insights via IT style directory and utilization statistics. While these measures are “good enough” for basic enforcement, they provide no real insights into how data is used, protected and scaled.

Visibility across Cloud, On-Premise and Remote
HOW IT WORKS

POWERFUL ANALYTICS & VISUALIZATION TOOLSET
Project & Dept Utilization
Get detailed stats and charts by project, user or department across all locations.
Storage Visualization
Visualize data across disk, cloud, hard drives and tape with ability to track spending and growth.
Data Growth Tracking
Track data growth and deletion across projects, users and departments enabling accountability.
Duplication Graphs
Live graphs report user and departments duplication and storage utilization efficiency rates.
Protection Charts
Local and remote replication graphs provide up-to-date feedback on protection status.
SLA Filtering
Set and monitor data protection and access SLAs based on business rules and practices.


